Unpaid invoices during a pandemic
The measures announced by the governments following the pandemic were brutal and severe. The economic consequences will be felt for several years.What do we see for the first few months regarding unpaid invoices? What can we anticipate?
Cash collection at TCM since 2017
What are the recovery figures at TCM in times of the pandemic compared to previous years? We promised them to you in ourarticle on cash flow; here they are! (If you are already a customer with us, you can quickly and easily prepare a similar analysis of your files via the ‘Power BI’tool in our online system.)
Payments (EUR) posted / month (Jan-Aug); comparison2017,2018,2019et2020
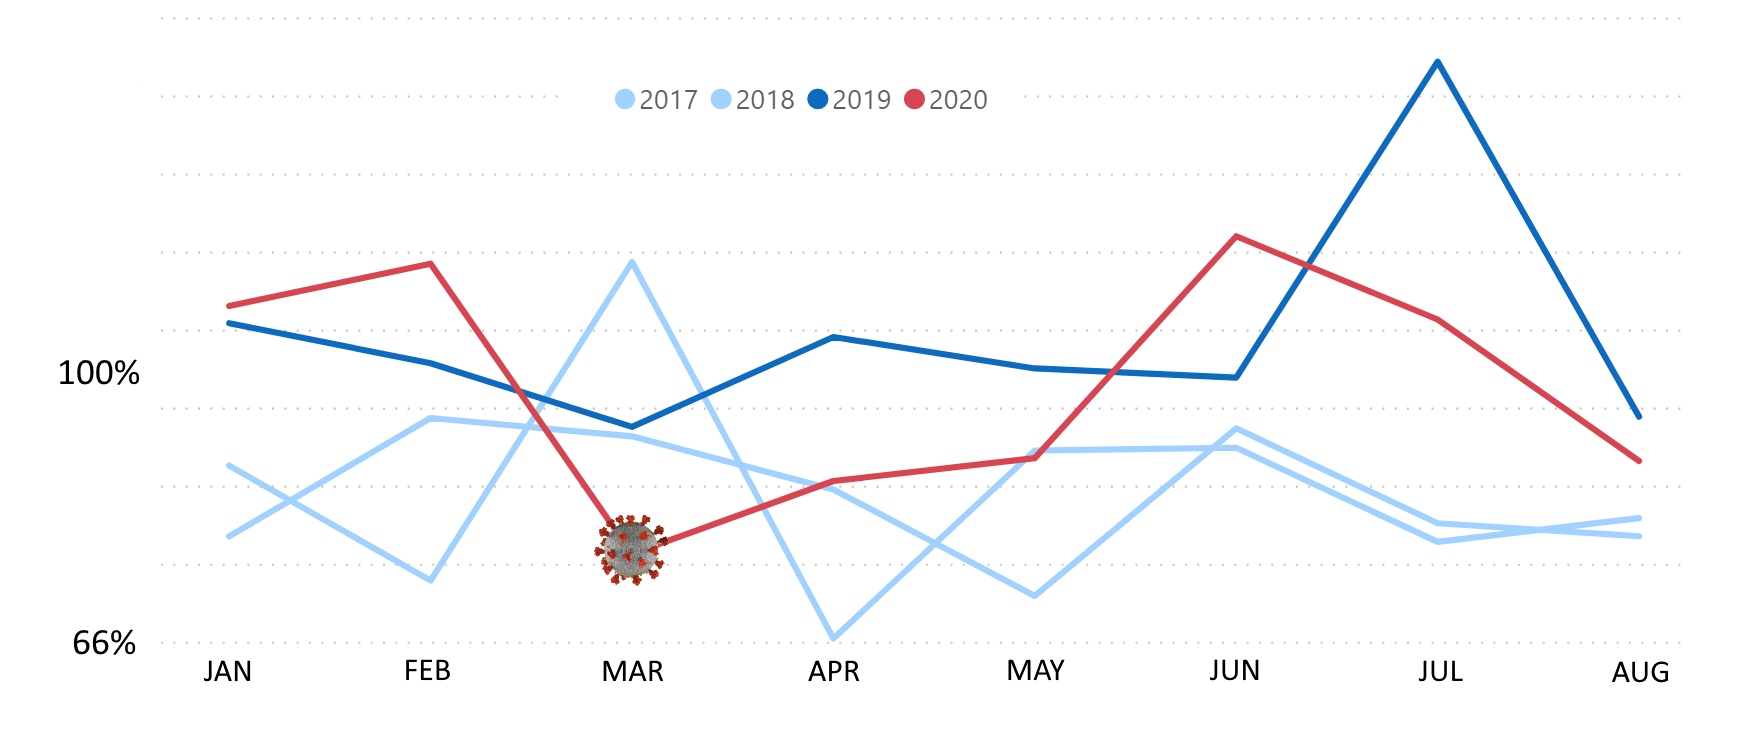
Payments of receivables managed by TCM Belgium (sample> 100,000 collections)
TCM is growing, as shown by the2019curve which is above2018and2017. In January and February last year, everything indicated that2020would overtake 2019. But the last two weeks of March 2020 saw a collapse. And while there was an upturn in June, it could not be sustained in July and August.
| EUR collected 2020 compared to 2019 | ||
| Jan | 102% | 1st Quarter: 100% |
| Feb | 112% | |
| Mar | 83% | |
| Apr | 83% | 2ndQuarter: 96% |
| May | 89% | |
| Jun | 117% | |
| Jul | 77% | |
| Aug | 89% |
The presentation by quarter allows a comparison to national figures butdoes not coincide with the quarantine which began on March 18. The impact of the last two weeks of March, which recorded a 50% drop in debtor payments, is significant in the first quarter.
The analysis by number of payments confirms these trends (observed on the sum of EUR cashed). But,since a statistical correlation is not enough to draw conclusions, let’s see if these numbers make sense?
The direct economic consequences of confinement
A bad April Fool’s Day
Up until February 2020, the coronavirus was a Chinese problem that did not impact our European societies. On February 21, 2020, Italy locked parts of the north down and then, on March 9, the whole country. On March 11, the WHO declared the epidemic to be a pandemic (impacting countless commercial contracts with force majeure clauses that included the notion of a pandemic).On March 18, Belgium was in turn locked down.
Our governments and our people were not prepared. The shock was brutal. None of us imagined on March 1 that April Fool’s Day would be so bad!
For consumers
The lockdown meant animmediate closureof stores (except food and health) and restaurants or other places of social life such as schools. We could no longer freely go to our places of work: access was prohibited except by filling out affidavits (the content of which was uncertain). This of course exempted priority businesses. Subsequently, the rules were slowly relaxed but with an uncertain future.
Consumerssavedduring the lockdown. At first sight, this could result from a drastic reduction in spending opportunities (restaurants, holidays, shopping) coupled with an underlying anxiety (which generally encourages savings). But the explanation is certainly more complex and more diverse (with important differences from family to family).
For companies
The lockdown has physically prevented many companies from working (except for priority sectors such as health). These companies were able to resort to furlough, which was probably the most useful measure to limit the economic damage. Restaurant owners and other traders received a bonus whose effectiveness is uncertain, if only, coupled with announcements of massive budgets, reassured workers and consumers.
GDP fell by 12.2% in the 2nd quarter of2020(14.5% compared to Q2 / 2019); an unprecedented nose-dive in Belgium (and similar collapses all over the world). TheGDPis in fact the sum of theadded values(difference between sales and purchases) of all (Belgian) companies. Remember also that at other times, a variation of 1% from one quarter to the next is experienced as an event.
During the same 2nd quarter, the turnover of Belgian companies fell by 19.3% (StatBel). This, combined with that of GDP for the same period, suggests that corporate spending has also fallen.
It remains to be seen whether such drastic measures were necessary. There are indeed discussions and doubts about the relevance and effectiveness of the measures taken (see the recentbook by two statisticianswhich would be useful to some analysts and journalists, and theopen letterof 64 well-known personalities).
Interpretation of TCM payment curves
While GDP fell 12.5% in the second quarter, TCM’sdebtor’s payments droppedbyonly 4%for the same period. Several factors influence our collections: (1) the intake of new files, (2) the quality of these files, (3) our ability to collect and (4) the ability of debtors to pay their debts.
- Transmission of new files
For us to operate collections, creditors must entrust us with debts. Here too, we see a deficit, particularly in April and May 2020, compared to previous years. From our contacts with our clients, they seem focused on dealing with the immediate crisis.We anticipate an increase in new cases in the 4th quarter.
This drop in new cases could partly explain the decline in collections. But in fact, when we go into more detail (B2B-B2C; small claims – large claims; Belgium – foreign), we find that this explanation can neither be validated nor invalidated. It probably explains only a small part of the decline in inflows.
. - Quality of claims
We do not have the same success rates in all trades. This depends, for example, on whether the debts are recent or old, on the type of debtors (consumers or companies), on the sectors of activity (finance, services, manufacturing, etc.), and of course, on the creditor (his economic model, the work he did before, during and after the sales process of the goods or service in question). But thisquality of claims has not changed significantly for monthsand cannot explain a drop in collections.
. - Quality of work at TCM
Obviously, if we had closed shop, a drop in collections would have been the natural consequence. In fact, that could only partly explain the decline in the second half of March 2020, and again, it is not obvious.
. - The solvency of debtors
The drop in cash collected can also be explained by the fall in average turnover in Belgium(-19.3%) as explained above. Less turnover results in fewer invoices to collect and less turnover results in less ability to pay supplier invoices.
Another explanation is the caution of debtorsin uncertain times: what is unpaid remains in the debtor’s account … for all safety. This is undoubtedly what explains why consumers saved in the second quarter of 2020 (see above).
Conclusion
The decline seemsmore marked in B2Bpayments than in B2C payments.
The most rational explanation for the B2B payments drop is to be found in thepayment capacity of debtors.
For B2C, people’scautious behaviour in the face of uncertaintyis probably essential, where compensation measures, such as temporary unemployment and lower spending such as vacations, have kept household solvency at a good level. However, these are averages: people who are already (economically) vulnerable risk losing 30% of income or even more (furlough that is prolonged or turns into regular unemployment; people who already had difficulty in surviving are pushed into real poverty by the virus, people in precarious employment are less protected, etc.). On the other hand, the economically less vulnerable people were able to save more.
The economy needs stability and a predictable horizon.Unfortunately, the current situation makes it difficult for all of us to assess a plausible future.
Questions?Contact us.
The measures announced by the governments following the pandemic were brutal and severe. The economic consequences will be felt for several years.What do we see for the first few months regarding unpaid invoices? What can we anticipate?
Cash collection at TCM since 2017
What are the recovery figures at TCM in times of the pandemic compared to previous years? We promised them to you in ourarticle on cash flow; here they are! (If you are already a customer with us, you can quickly and easily prepare a similar analysis of your files via the ‘Power BI’tool in our online system.)
Payments (EUR) posted / month (Jan-Aug); comparison2017,2018,2019et2020
Payments of receivables managed by TCM Belgium (sample> 100,000 collections)
TCM is growing, as shown by the2019curve which is above2018and2017. In January and February last year, everything indicated that2020would overtake 2019. But the last two weeks of March 2020 saw a collapse. And while there was an upturn in June, it could not be sustained in July and August.
| EUR collected 2020 compared to 2019 | ||
| Jan | 102% | 1st Quarter: 100% |
| Feb | 112% | |
| Mar | 83% | |
| Apr | 83% | 2ndQuarter: 96% |
| May | 89% | |
| Jun | 117% | |
| Jul | 77% | |
| Aug | 89% |
The presentation by quarter allows a comparison to national figures butdoes not coincide with the quarantine which began on March 18. The impact of the last two weeks of March, which recorded a 50% drop in debtor payments, is significant in the first quarter.
The analysis by number of payments confirms these trends (observed on the sum of EUR cashed). But,since a statistical correlation is not enough to draw conclusions, let’s see if these numbers make sense?
The direct economic consequences of confinement
A bad April Fool’s Day
Up until February 2020, the coronavirus was a Chinese problem that did not impact our European societies. On February 21, 2020, Italy locked parts of the north down and then, on March 9, the whole country. On March 11, the WHO declared the epidemic to be a pandemic (impacting countless commercial contracts with force majeure clauses that included the notion of a pandemic).On March 18, Belgium was in turn locked down.
Our governments and our people were not prepared. The shock was brutal. None of us imagined on March 1 that April Fool’s Day would be so bad!
For consumers
The lockdown meant animmediate closureof stores (except food and health) and restaurants or other places of social life such as schools. We could no longer freely go to our places of work: access was prohibited except by filling out affidavits (the content of which was uncertain). This of course exempted priority businesses. Subsequently, the rules were slowly relaxed but with an uncertain future.
Consumerssavedduring the lockdown. At first sight, this could result from a drastic reduction in spending opportunities (restaurants, holidays, shopping) coupled with an underlying anxiety (which generally encourages savings). But the explanation is certainly more complex and more diverse (with important differences from family to family).
For companies
The lockdown has physically prevented many companies from working (except for priority sectors such as health). These companies were able to resort to furlough, which was probably the most useful measure to limit the economic damage. Restaurant owners and other traders received a bonus whose effectiveness is uncertain, if only, coupled with announcements of massive budgets, reassured workers and consumers.
GDP fell by 12.2% in the 2nd quarter of2020(14.5% compared to Q2 / 2019); an unprecedented nose-dive in Belgium (and similar collapses all over the world). TheGDPis in fact the sum of theadded values(difference between sales and purchases) of all (Belgian) companies. Remember also that at other times, a variation of 1% from one quarter to the next is experienced as an event.
During the same 2nd quarter, the turnover of Belgian companies fell by 19.3% (StatBel). This, combined with that of GDP for the same period, suggests that corporate spending has also fallen.
It remains to be seen whether such drastic measures were necessary. There are indeed discussions and doubts about the relevance and effectiveness of the measures taken (see the recentbook by two statisticianswhich would be useful to some analysts and journalists, and theopen letterof 64 well-known personalities).
Interpretation of TCM payment curves
While GDP fell 12.5% in the second quarter, TCM’sdebtor’s payments droppedbyonly 4%for the same period. Several factors influence our collections: (1) the intake of new files, (2) the quality of these files, (3) our ability to collect and (4) the ability of debtors to pay their debts.
- Transmission of new files
For us to operate collections, creditors must entrust us with debts. Here too, we see a deficit, particularly in April and May 2020, compared to previous years. From our contacts with our clients, they seem focused on dealing with the immediate crisis.We anticipate an increase in new cases in the 4th quarter.
This drop in new cases could partly explain the decline in collections. But in fact, when we go into more detail (B2B-B2C; small claims – large claims; Belgium – foreign), we find that this explanation can neither be validated nor invalidated. It probably explains only a small part of the decline in inflows.
. - Quality of claims
We do not have the same success rates in all trades. This depends, for example, on whether the debts are recent or old, on the type of debtors (consumers or companies), on the sectors of activity (finance, services, manufacturing, etc.), and of course, on the creditor (his economic model, the work he did before, during and after the sales process of the goods or service in question). But thisquality of claims has not changed significantly for monthsand cannot explain a drop in collections.
. - Quality of work at TCM
Obviously, if we had closed shop, a drop in collections would have been the natural consequence. In fact, that could only partly explain the decline in the second half of March 2020, and again, it is not obvious.
. - The solvency of debtors
The drop in cash collected can also be explained by the fall in average turnover in Belgium(-19.3%) as explained above. Less turnover results in fewer invoices to collect and less turnover results in less ability to pay supplier invoices.
Another explanation is the caution of debtorsin uncertain times: what is unpaid remains in the debtor’s account … for all safety. This is undoubtedly what explains why consumers saved in the second quarter of 2020 (see above).
Conclusion
The decline seemsmore marked in B2Bpayments than in B2C payments.
The most rational explanation for the B2B payments drop is to be found in thepayment capacity of debtors.
For B2C, people’scautious behaviour in the face of uncertaintyis probably essential, where compensation measures, such as temporary unemployment and lower spending such as vacations, have kept household solvency at a good level. However, these are averages: people who are already (economically) vulnerable risk losing 30% of income or even more (furlough that is prolonged or turns into regular unemployment; people who already had difficulty in surviving are pushed into real poverty by the virus, people in precarious employment are less protected, etc.). On the other hand, the economically less vulnerable people were able to save more.
The economy needs stability and a predictable horizon.Unfortunately, the current situation makes it difficult for all of us to assess a plausible future.
Questions?Contact us.
Related
Related News

Samsonite collects via TCM – Testimony
For Samsonite, one of TCM's many advantages is their personal approach for debt collection claims both on national and international level. << The Samsonite success story started in 1910 in....
Learn More- May 18, 2016
- google@freshblend.be

Debt collection in China
TCM China, established in Qingdao in 1997, has 35 branches in major city of China and hundreds of offices in smaller cities. TCM China has 2000 people on it payroll. ....
Learn More- July 20, 2016
- google@freshblend.be

Who could help me getting invoices paid?
Whether you are a private person, a SMEntreprise (99% of businesses in Europe) or a multinational, unpaid invoices are a painful and delicate matter. It is usually a source for....
Learn More- October 31, 2016
- google@freshblend.be
Our Partners